One of the traditional ways to measure the effectiveness of an email marketing campaign is to look at open and click-through rates. In this blog post, however, we take a look at another performance measurement that you might not have considered before: conversion rate.

What is a conversion rate?
When we talk here about conversion rates, we are talking about what percentage of your email subscribers have taken some kind of action that (1) can be tracked and (2) goes beyond opening or clicking a link in your email. Common examples might include:
- what percentage of your email subscribers purchased something from your website, or
- filled out a form or survey on your website, or
- downloaded something from your website, or
- scheduled an appointment with you, or
- signed up for your event online
When one of those actions takes place, we say that the person has converted. You may have noticed that the above examples are all actions that take place on your website. If you use a website analytics service (like Google Analytics) you can collect data on how many of your visitors convert, and learn what brought those visitors to your site. By combining Direct Mail’s email reporting with your website analytics, you can find out how effective your email campaigns are at driving conversions on your website—in other words, what your email campaign’s conversion rate is.
![]()
Using Google Analytics
The rest of this blog will make two assumptions:
- You are using Google Analytics on your website
- You have already set up one or more conversion “goals” on your website that you’d like Google Analytics to track
If you haven’t done those things yet, we recommend taking a look at one of these great Intro to Google Analytics courses:
Tagging your campaigns
Let’s say one of your email campaign goals is to get subscribers to click on a link in your email that takes them to your website. Once they’ve landed on your website, one of your goals may be for them to take an action that will convert them into a paying customer (or a repeat customer). Google Analytics can show you what percentage of your website visitors have converted, and, with an extra 5 seconds of work on your part, it can also show you which email campaigns those website visitors came from.
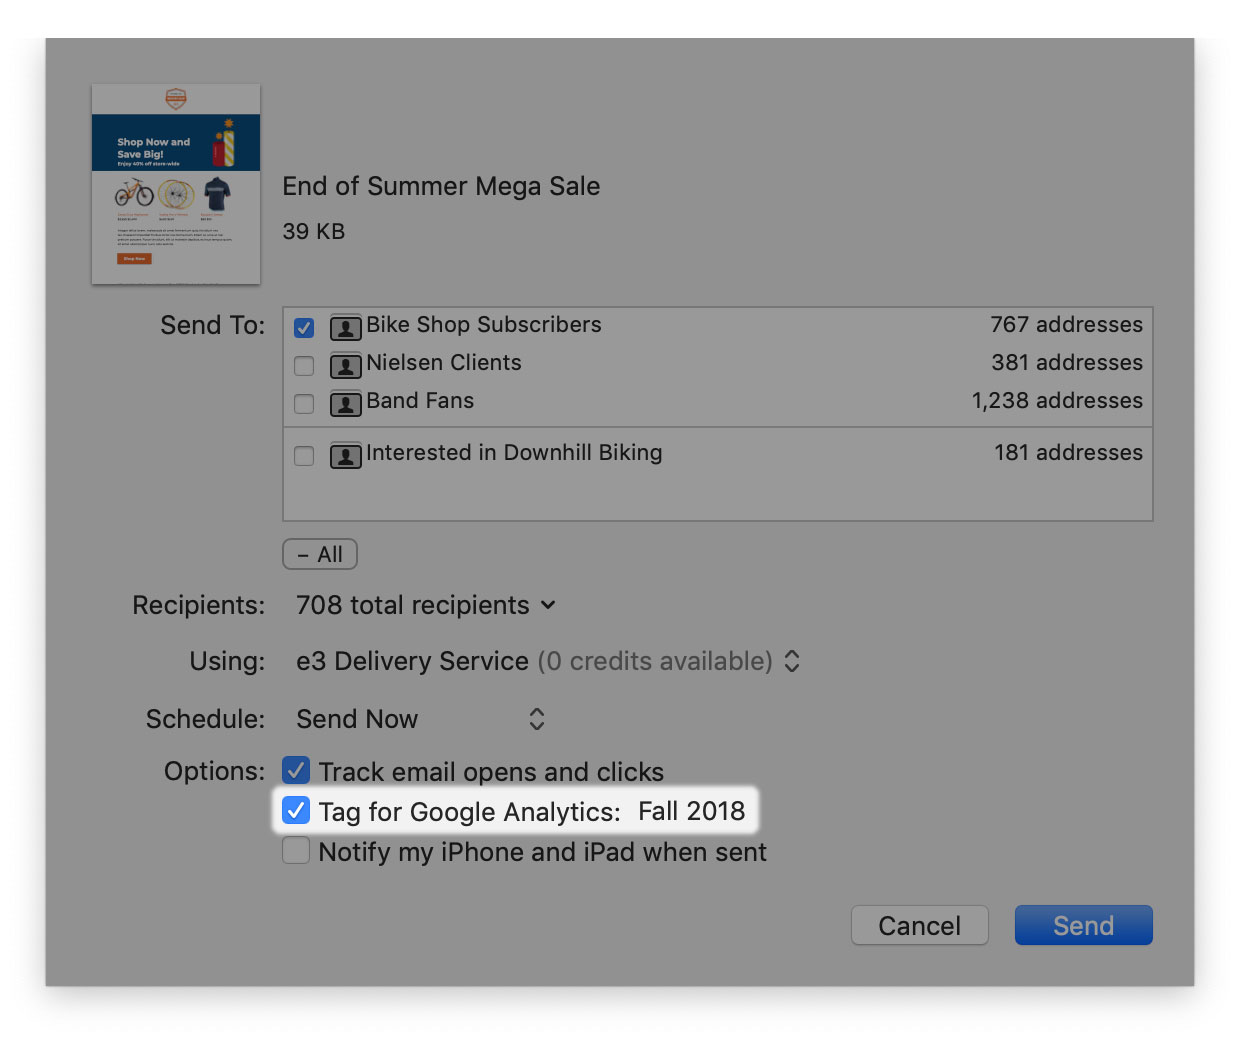
To get these extra insights, you need to tell Direct Mail to “tag” the links in your email campaign. This is done by checking the “Tag for Google Analytics” checkbox that appears when you send a campaign. You can also optionally enter a custom campaign name (e.g. “Fall 2018”). If you do not enter a campaign name, it defaults to the subject line of your message. The campaign name will be shown in Google Analytics—it is not visible to your recipients.

When you send your message, Direct Mail appends some extra information to the links in your email. When someone clicks a link in your email, this extra information tells Google Analytics that the visitor came from your email campaign. This is what allows Google Analytics to attribute that visitor’s conversion (if they convert) to your email campaign.
Viewing the results in Google Analytics
After you have sent your email campaign, you can view open and click reports in Direct Mail like normal. To access the extra Google Analytics conversion data, you’ll want to sign in to your Google Analytics account in your browser.
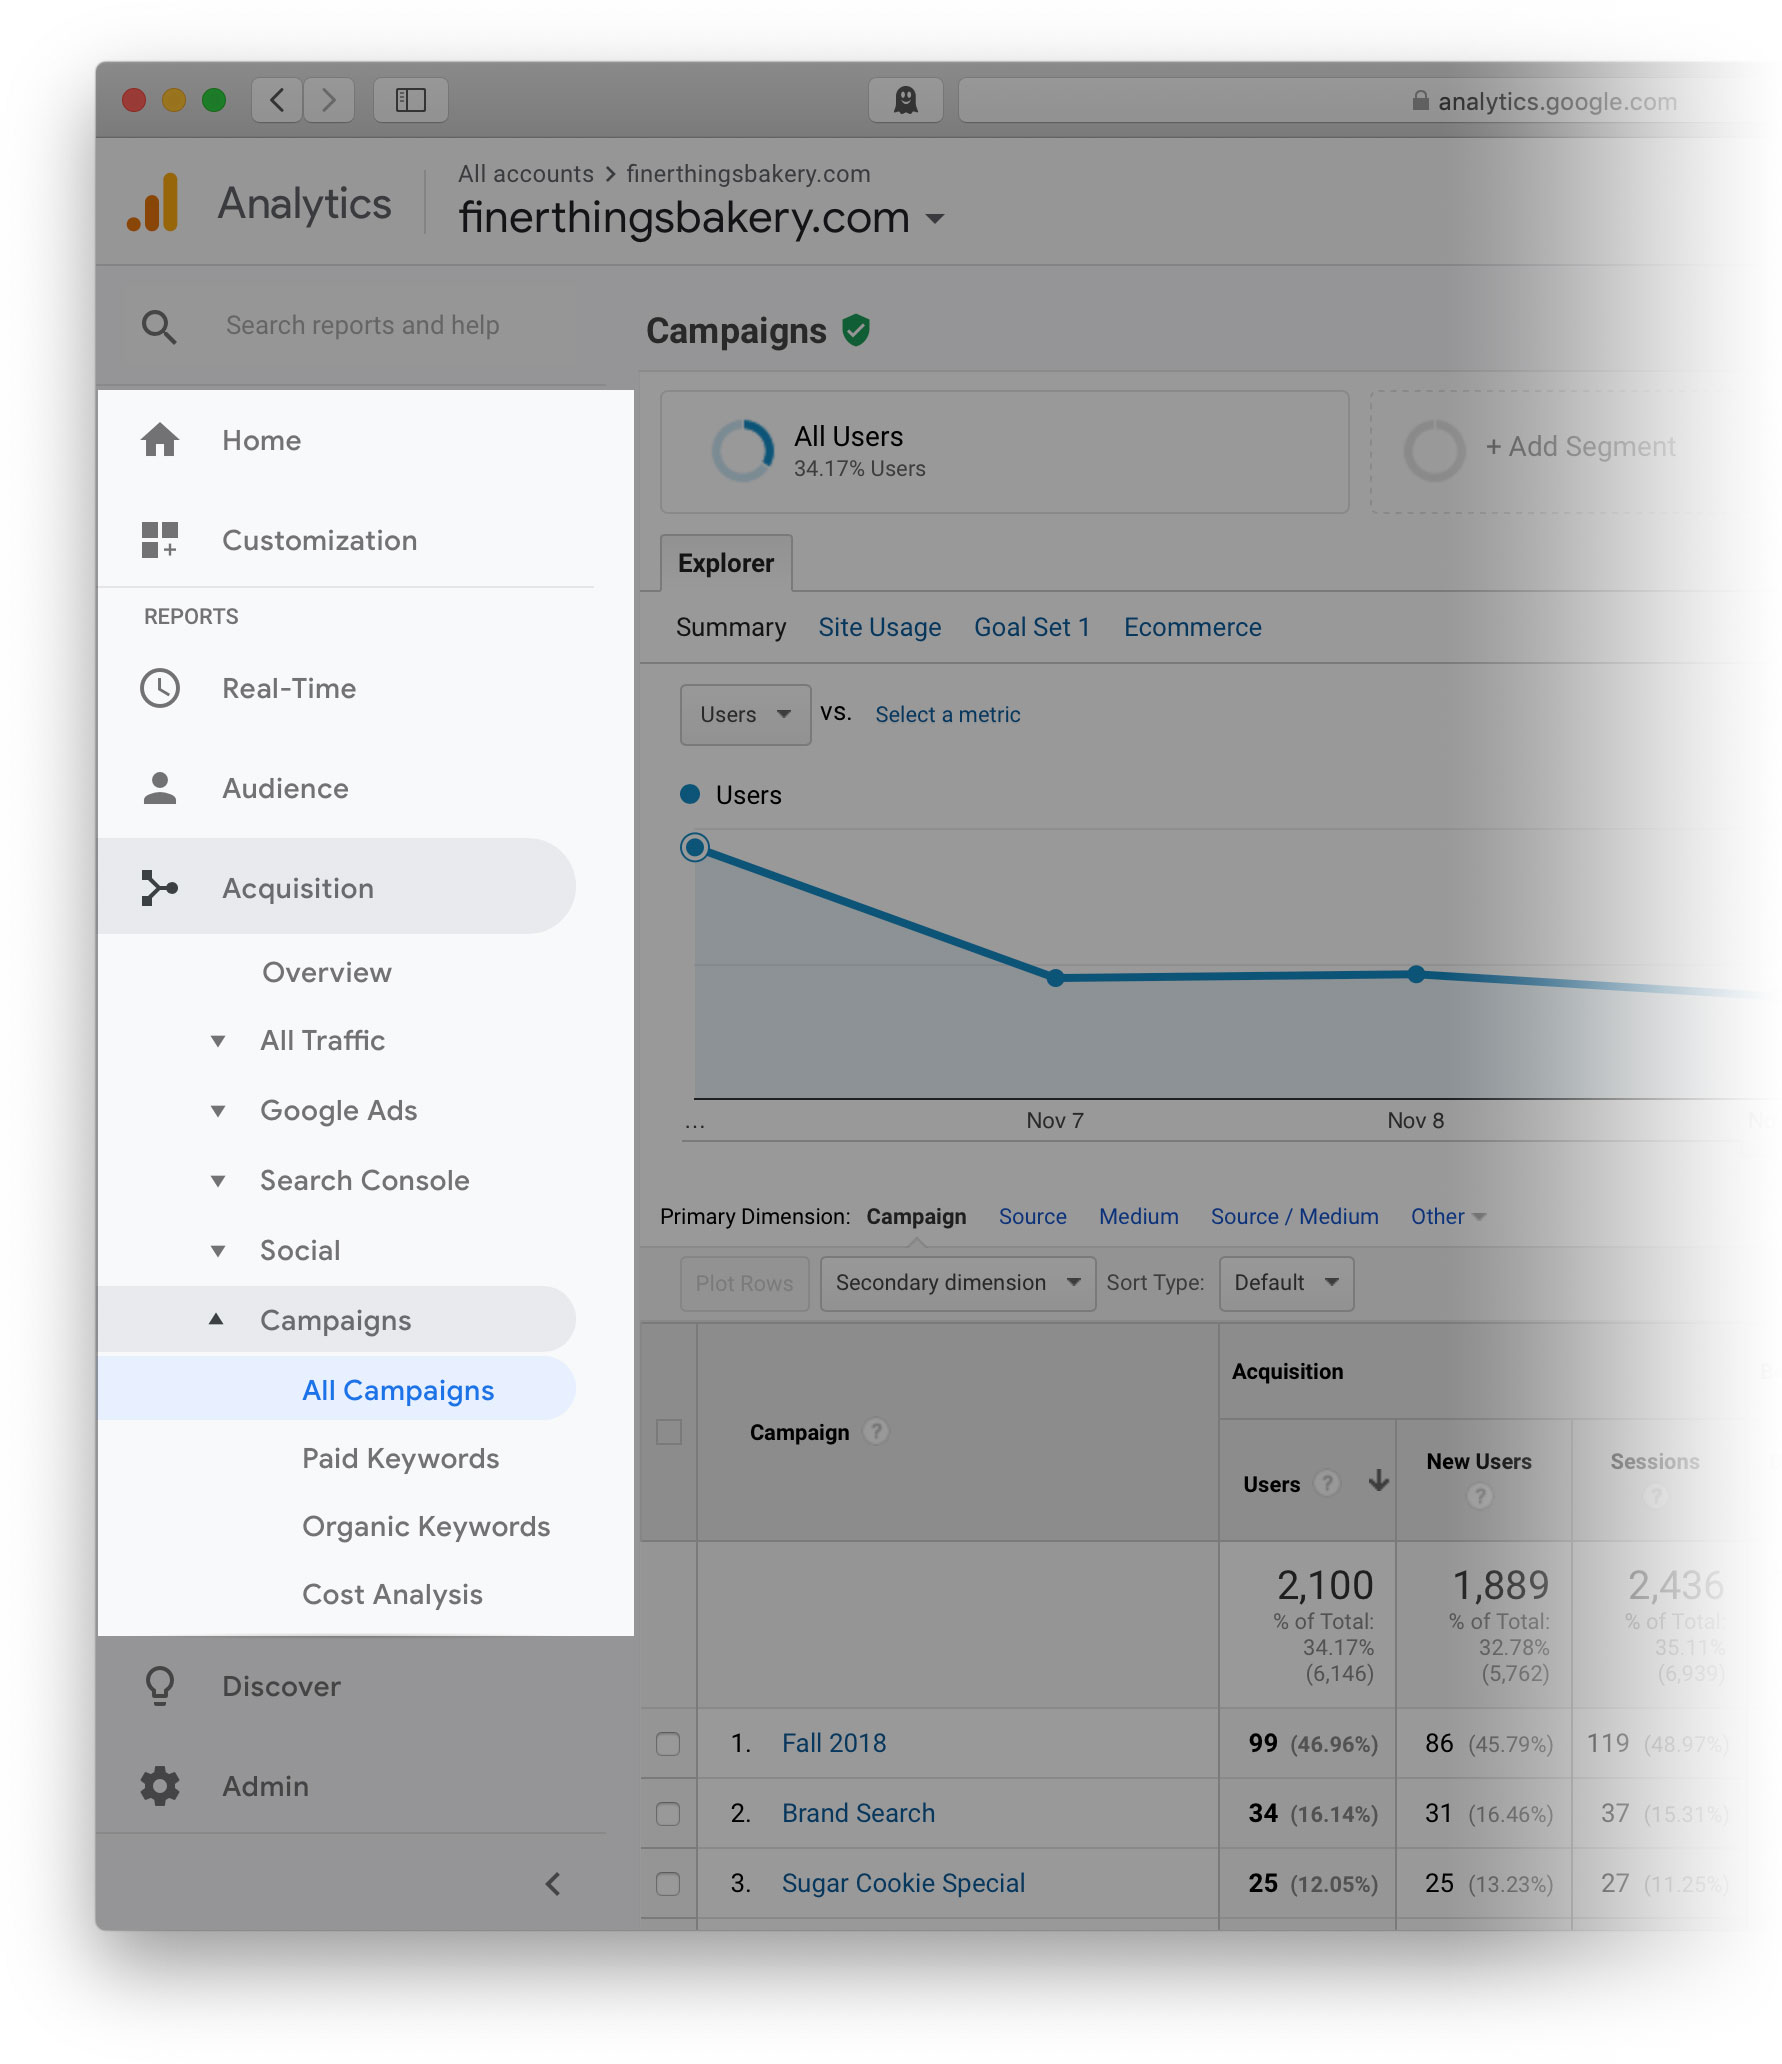
Once you’ve signed in, click on the “Acquisition” link on the left-hand side, then click “Campaigns”, then click “All Campaigns”

You will see a list of all of the campaigns that Google Analytics is tracking. These campaigns include not only email campaigns sent by Direct Mail, but also other ad campaigns that you may be running to drive traffic to your site (like Google AdWords, Facebook ads, etc.). Find and click on the email campaign that you sent with Direct Mail—remember to look for the “campaign name” that you used above when clicking the “Tag for Google Analytics” button.

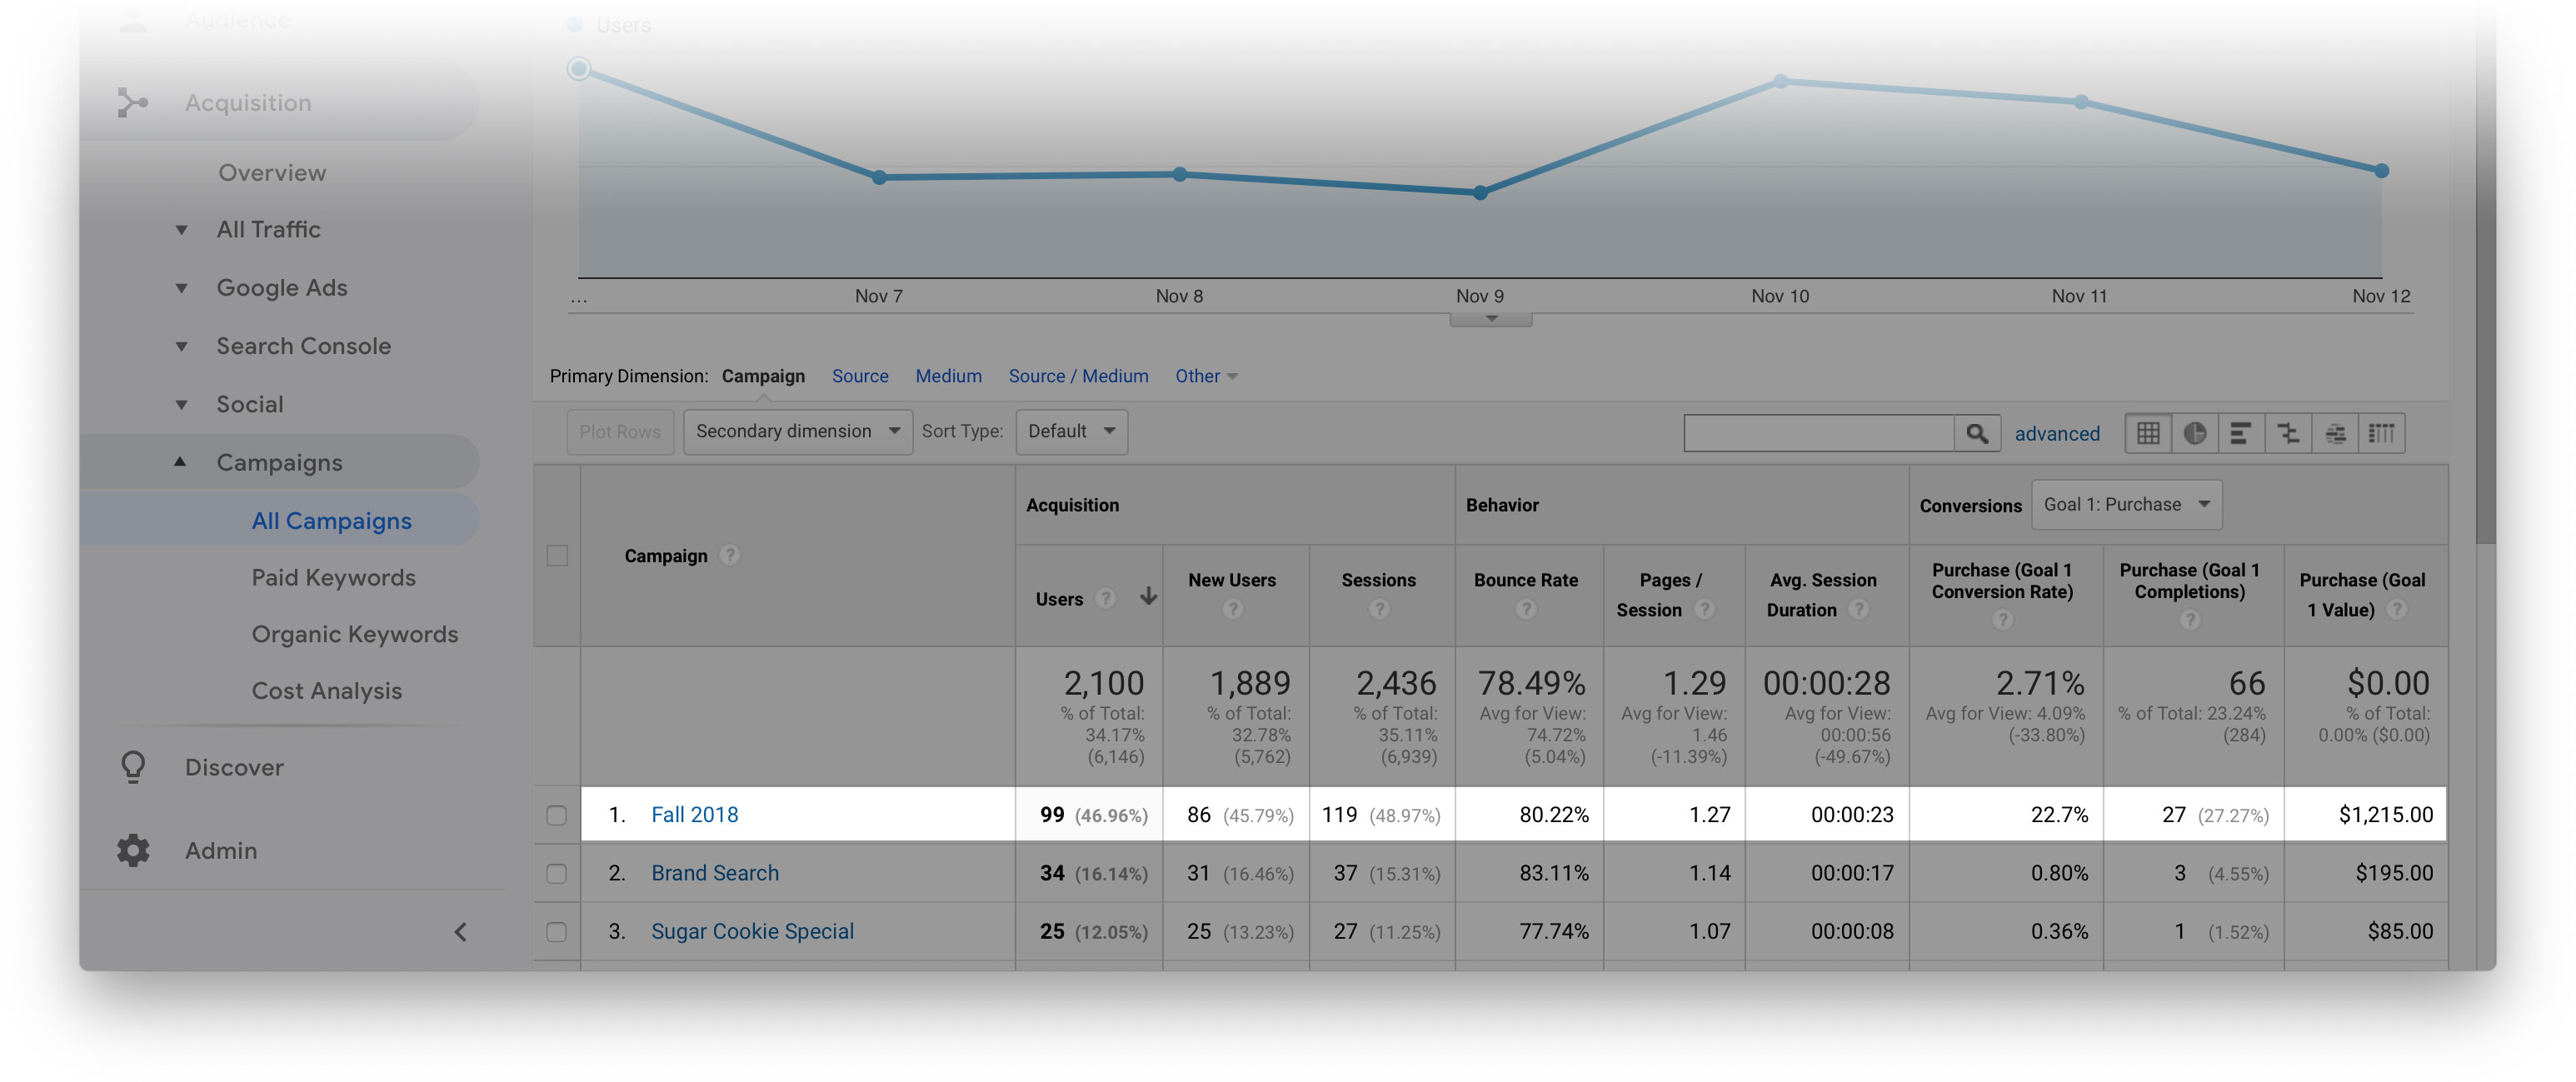
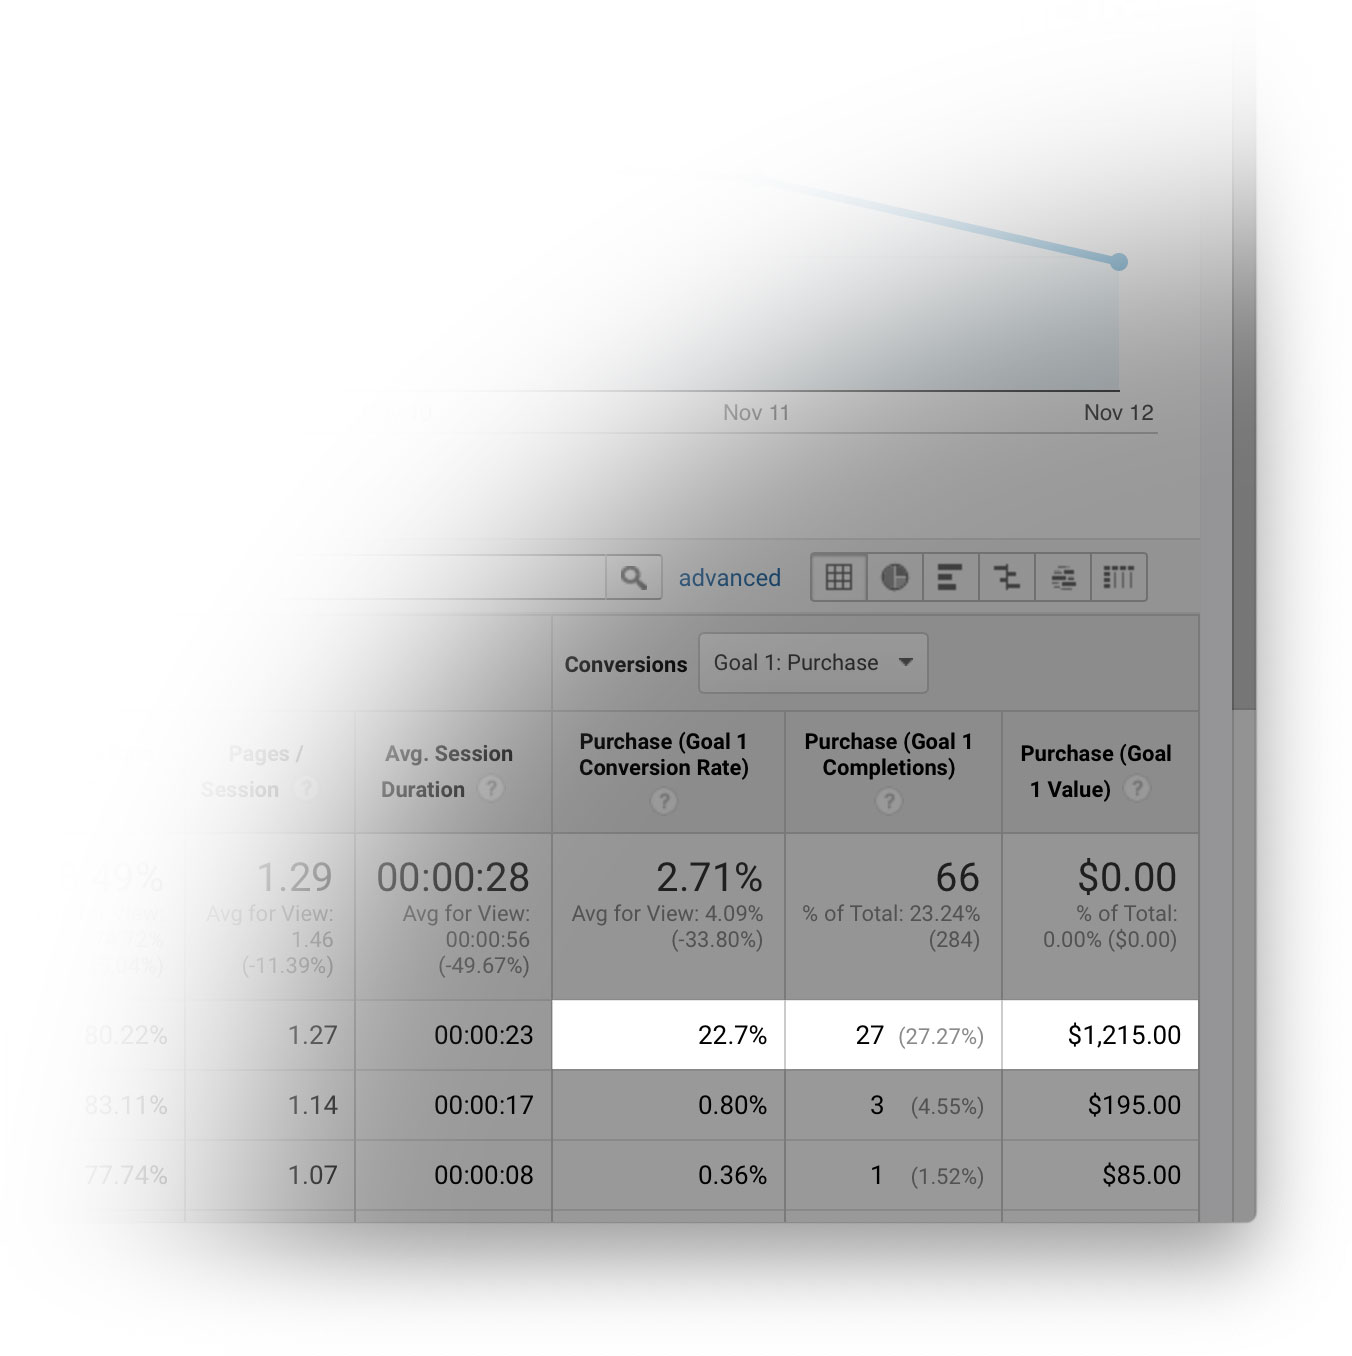
Viewing the columns left-to-right, you can see the metrics that Google Analytics is tracking: number of users, bounce rate, session duration, etc. The right-most group of columns may be the most interesting. These columns show the performance for the selected goal.

In this screenshot, we can see that the “Fall 2018” campaign resulted in 27 conversions for “Goal 1: Purchase”. This means that 27 people who received my “Fall 2018” email campaign clicked a link in the email and eventually went on to purchase something from my website—either right away or several days later. I originally sent this email campaign to 950 subscribers, so that makes my conversion rate 27 ÷ 950 = 2.8%. Nice!
If you want to see the combined conversion rate for all of your Direct Mail campaigns (instead of just one of them), click on “Acquisition”, then “Campaigns”, then “All Campaigns”, then click on “Source”. A list of all the campaign sources will appear—look for the one labeled “directmailmac”.

Conclusion
Open and click-through rates are not the only way to track campaign performance. Taking a look at conversion rates can yield additional insight. Direct Mail’s “Tag for Google Analytics” feature can help you uncover additional insights into how effective your campaigns are at converting leads into customers. If you have any questions about anything discussed in this blog post, or want to give feedback, please let us know!